(Homepage link button)

Links/Downloads    Photos   Weather Info    DVDs/CDs/Books    Cinema    Cams    TV/Radio    Travel    News

Last updated on 13-Apr-2023 09:14

(Scottish Flag)        (Scottish Flag)

Contact me hereClick here to send an email to Alister                       HPI       Jobs      (New Image)Hurricane         CotY     Covid-19      UK       Wx Obs     (New Image)Highland Games    Beaches     BBC WW        MO video       £ vs $        Gold        Brent   

Climate Observation Charts Met Office                    Back to Weather Info


(New Image)Met Office Climate and here for (New Image)Met Office Climate Monitoring        (New Image)Met Office Climate Dashboard


Met Office Climate Research Page Shows up to date global monthly summaries


Phenology The study of times of recurring natural phenomena


Chart showing daily NAO index

(New Image)Chart (above) showing daily NAO index from NOAA's Climate Prediction Centre Positive values usually gives westerly winds and mild conditions for the UK


Temperature Anomalies chart for past month over Europe


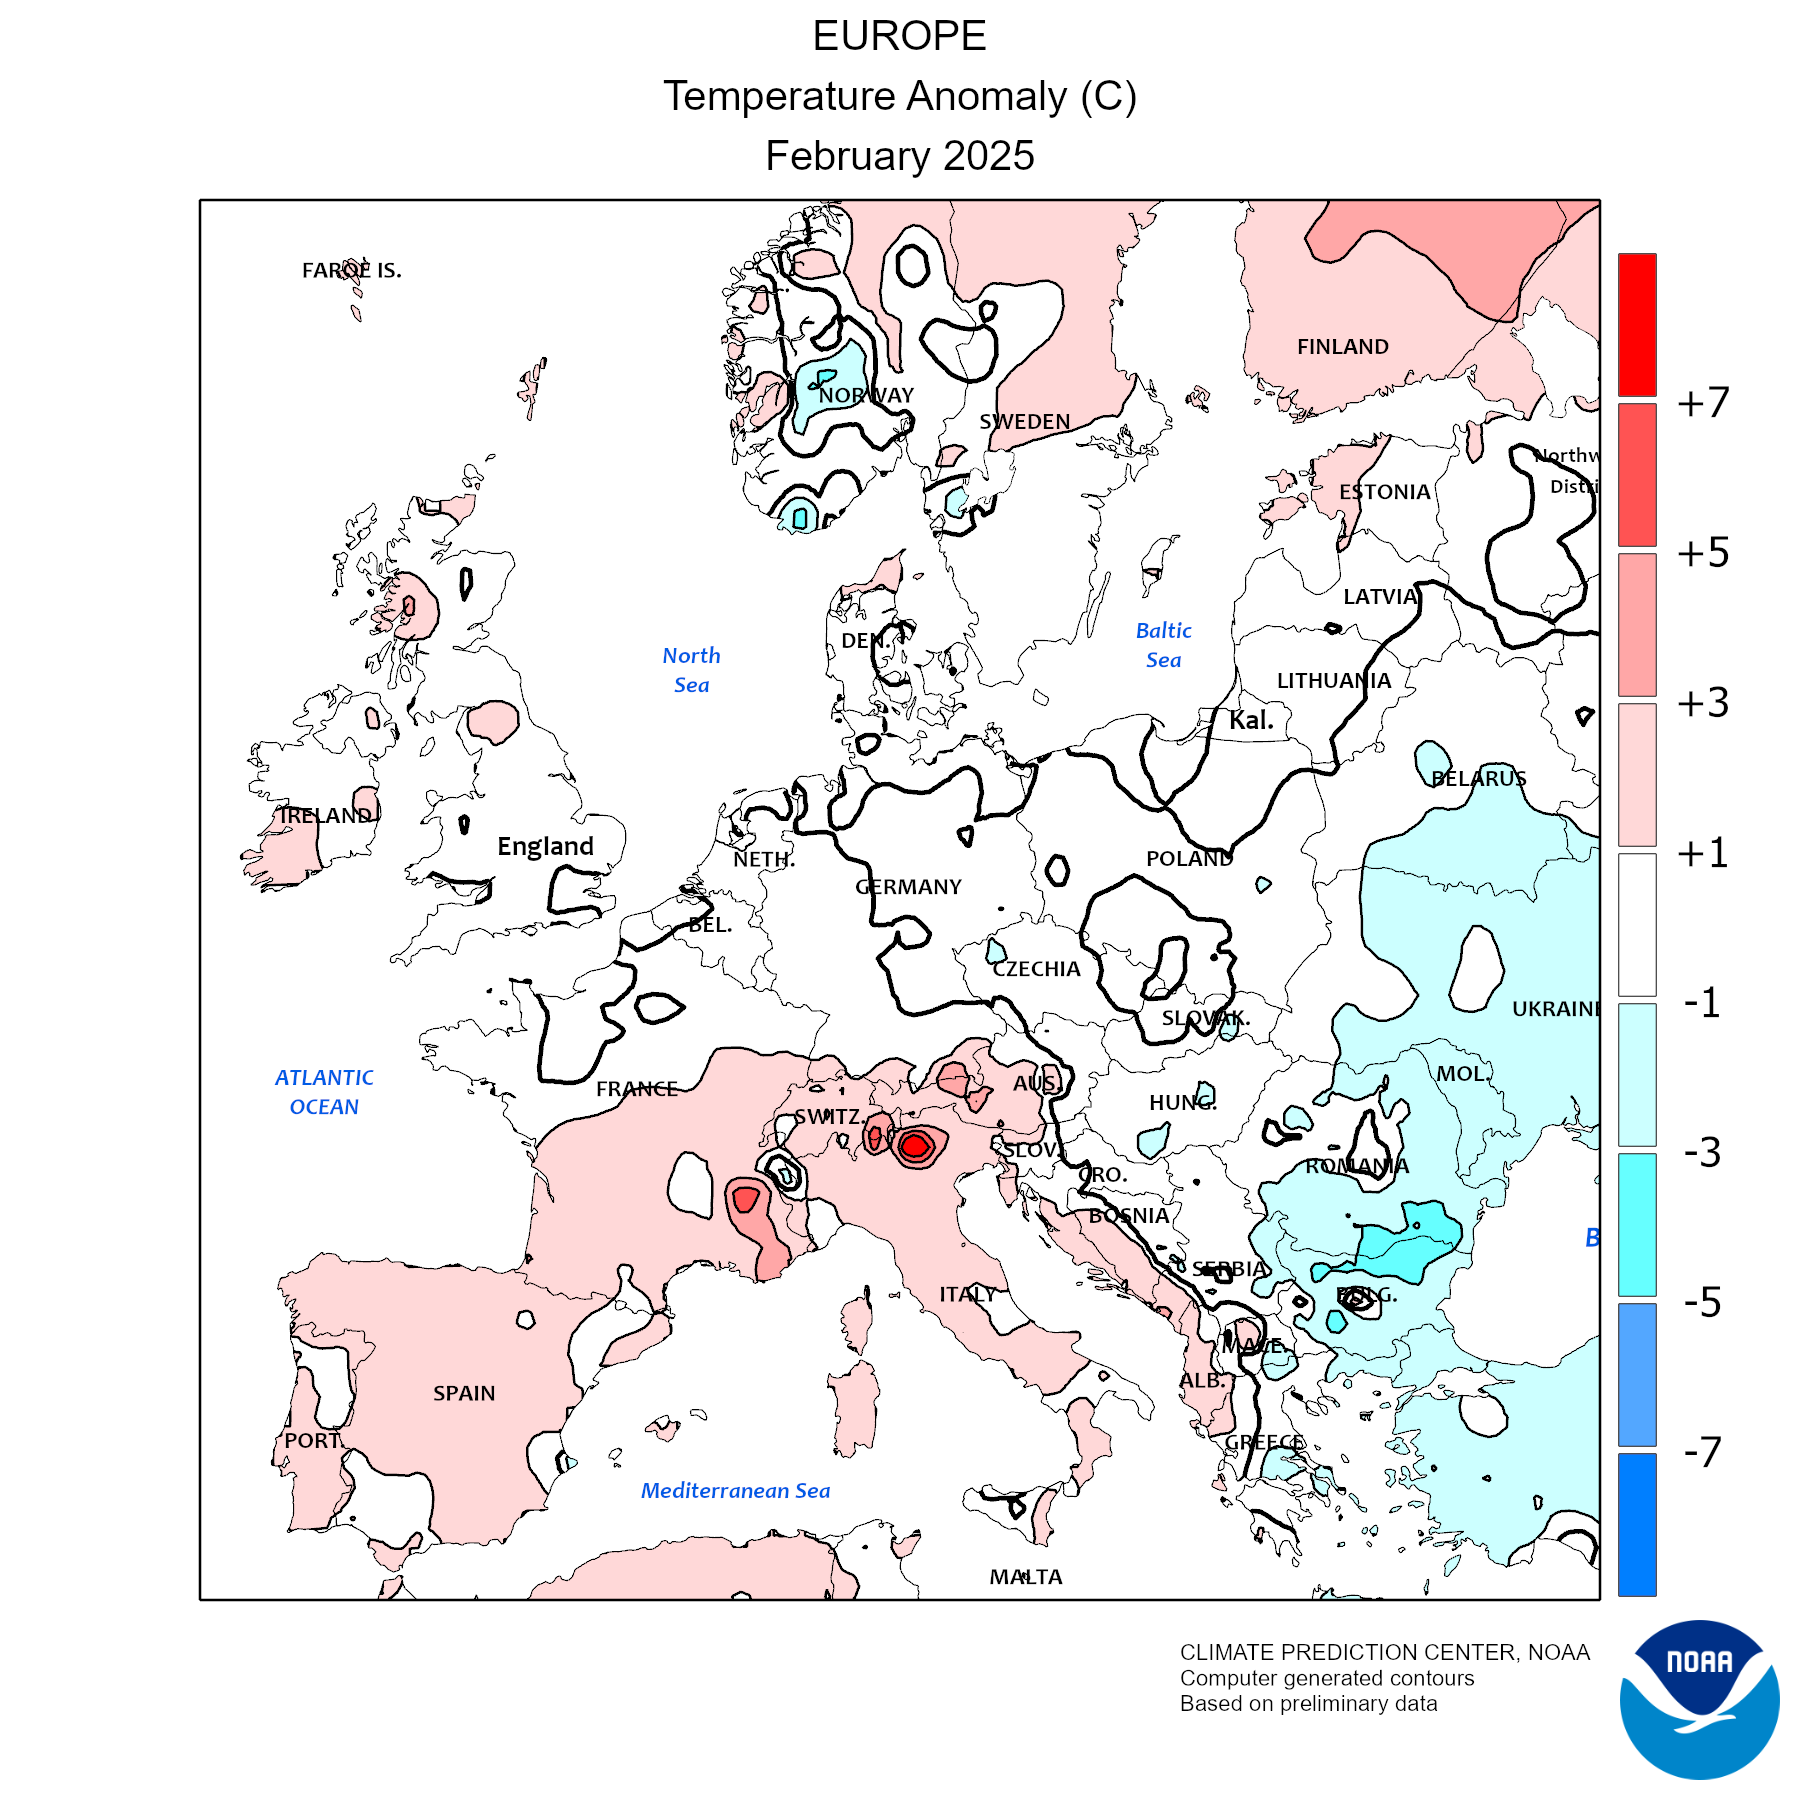
Chart above from NOAA Climate Prediction Centre showing the temperature anomaly for Europe for the past month


Global Temperature Anomalies chart for past month

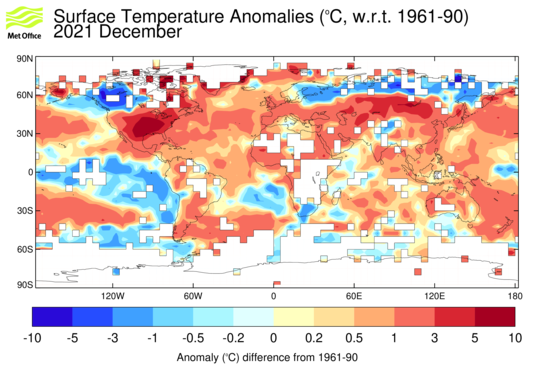
Chart above from Met Office showing the global temperature anomaly for the past month


(New Image)NOAA Climate report


Chart showing Observed and predicted global average annual surface temperature difference relative to 1850-1900

(New Image)Chart above from the Met Office


Central England Temperature (CET) Annual Anomalies 1772-Present Graph

Charts above and below from Met Office Climate Observations Page


Graph showing global average temperatures from 1850-present

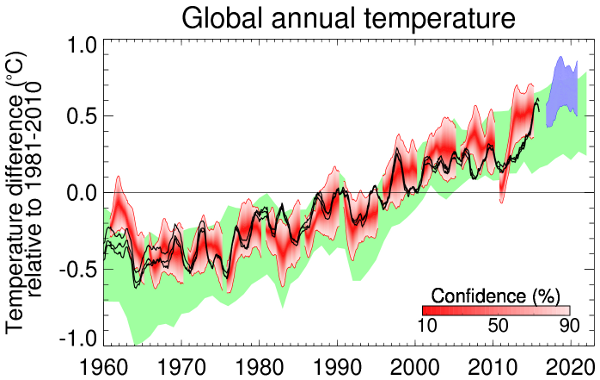
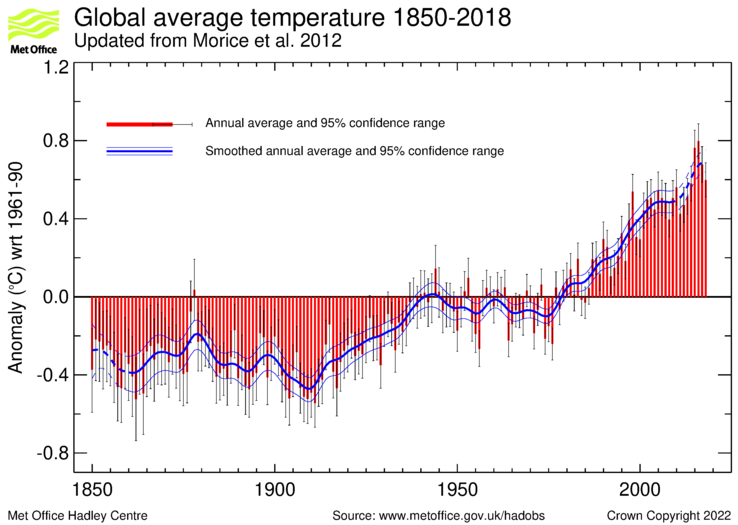
Global average temperatures from 1850-present from the Met Office


CET daily values for the year

Click here for Met Office climate monitoring page


Charts below from Met Office Climate Observations Page

England and Wales Precipitation Annual Totals 1766-Present Graph

England and Wales daily preciptiation for current month

Reconstructed temperature plots from various sources from 0-2004

Reconstructed temperature plots (above) from various sources from 0-2010

Latest picture showing extent of Arctic sea ice
Picture (above) showing extent of Arctic ice last month from NSIDC

Back to Weather Info

Links/Downloads  Photos Weather Info  DVDs/CDs/Books  Cinema  Cams  TV/Radio  Travel  News