![]()
Last updated on 13-Apr-2023 09:14
![]()
![]()

![]()
![]()
|
Last updated on 13-Apr-2023 09:14
|
|
| |
|
Sea Surface Temperatures SSTs (Celsius) Back to Weather Info
Met Office 6 month SST predictions Copernicus Global SSTs 2015-2020
and below from Wetterzentrale
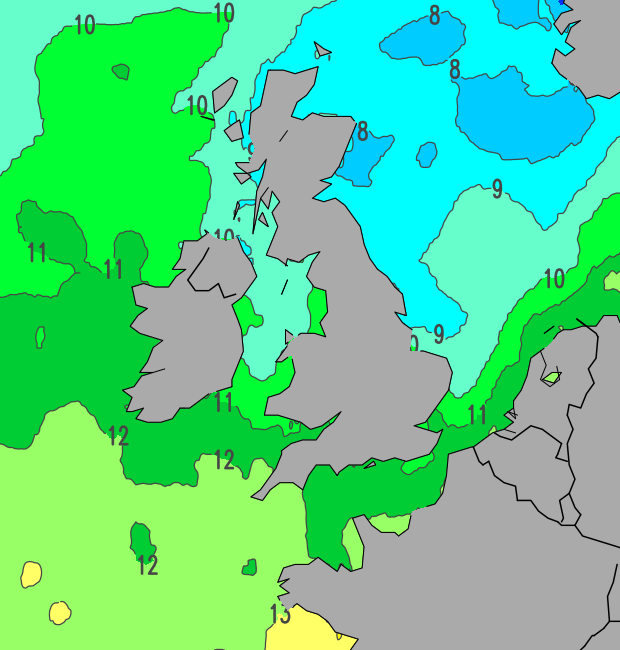
Above is latest sea temperature chart from Deutscher Wetterdienst
and below from Plymouth State Weather Center
Plot of latest global SST anomalies (above) from NOAA (Environmental Monitoring Center)
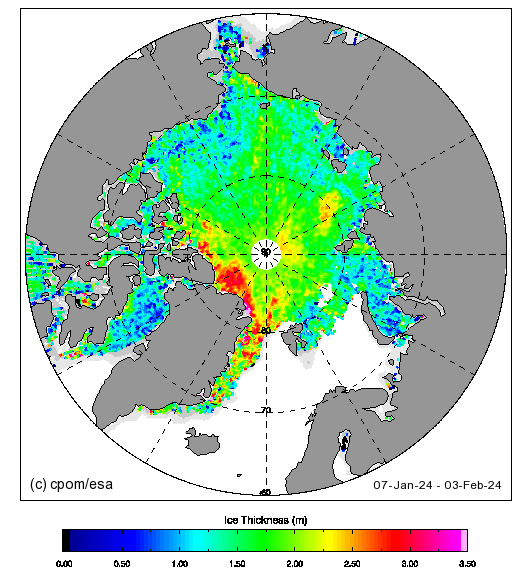
Pacific Ocean animated temperature anomalies in past 12 weeks from NOAA Climate Prediction Center which shows whether La Nina or El Nino dominates and on right (above) Cryosat Sea ice chart for Northern Hemisphere
Global animated sea surface temperature anomalies in past 12 weeks from NOAA Climate Prediction Center GHRSST Shows links to 11 global agencies measuring SSTs
NW Europe Hrly Temps North USA Hrly Temps UK Max and Mins 850hPa 16 Day Ensembles Sonde Data List and Sonde Data Map Links/Downloads Photos Weather Info DVDs/CDs/Books Cinema Cams TV/Radio Travel News |


 Charts
(above) showing latest available
Charts
(above) showing latest available